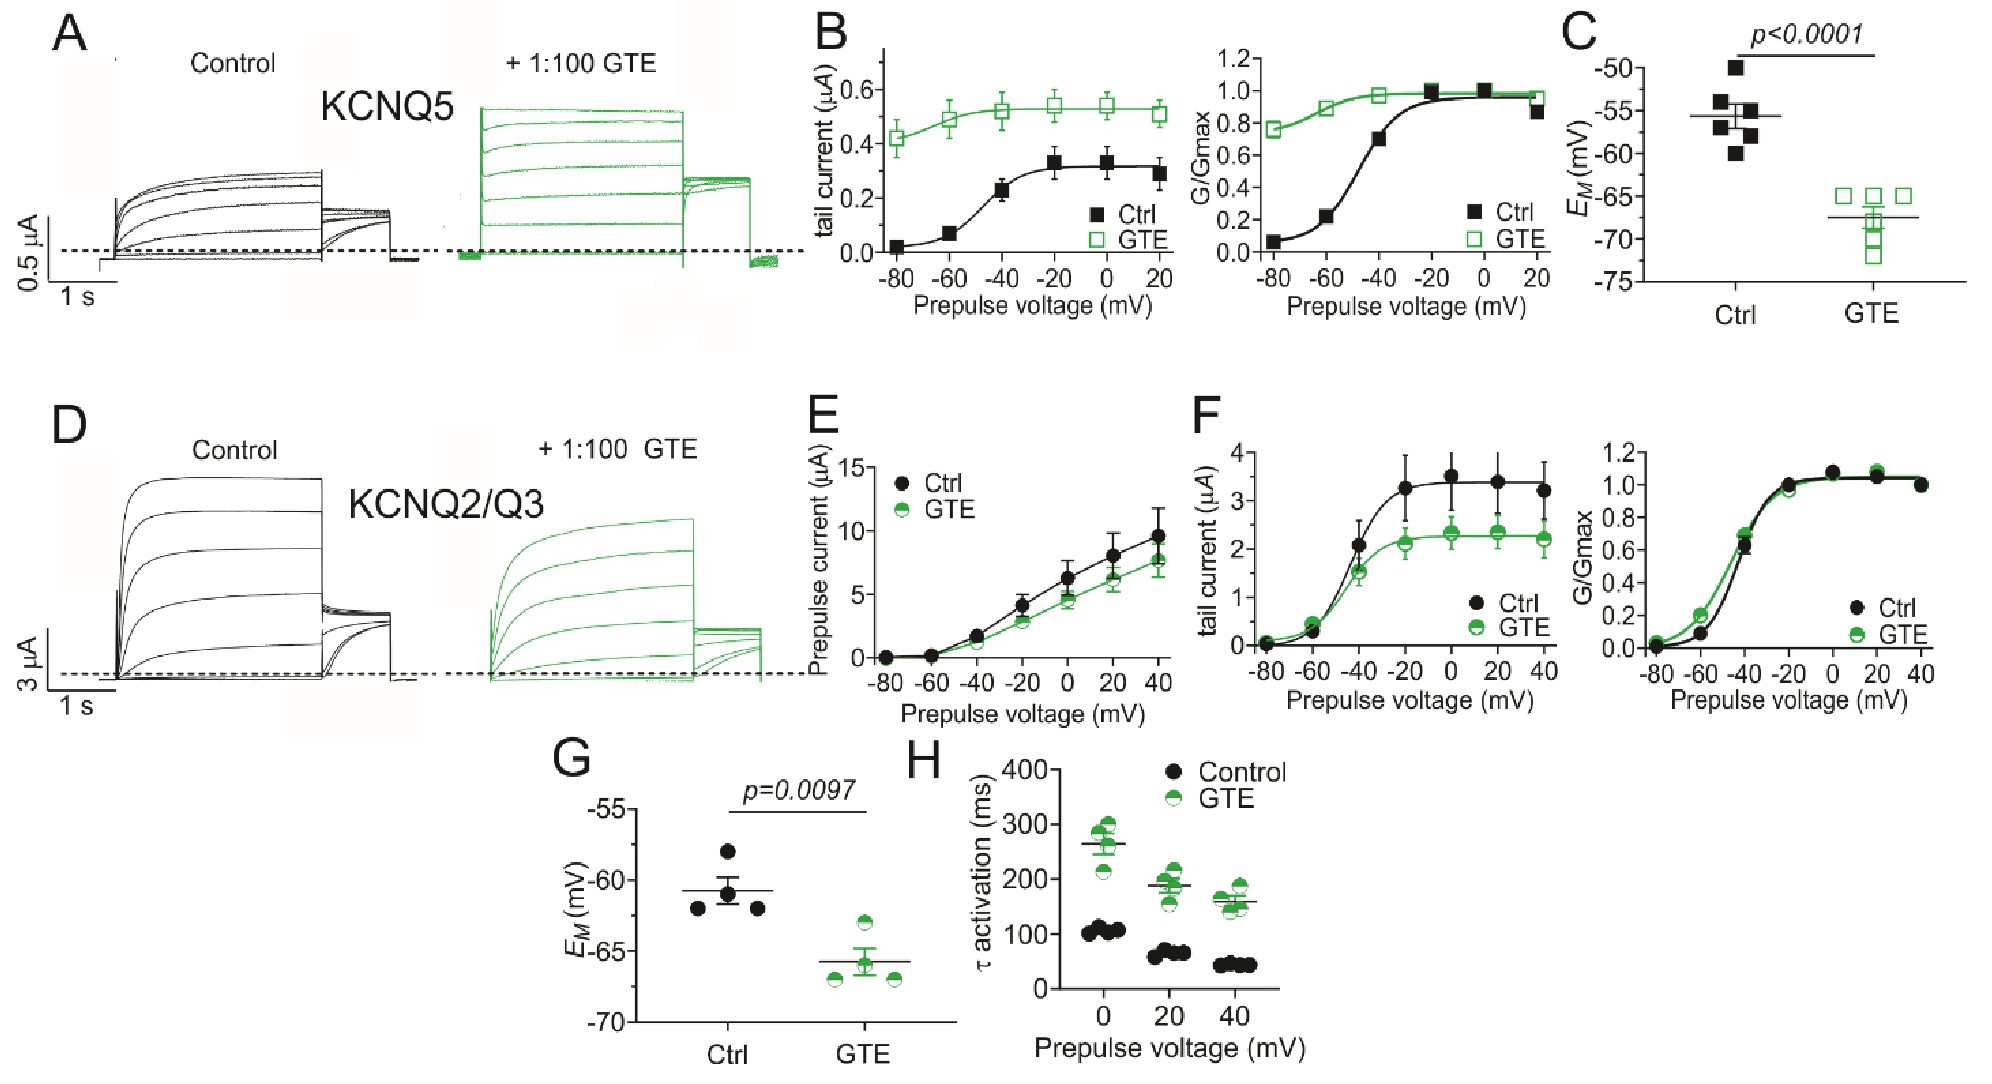
Fig. 2. Green tea activates KCNQ5, with mixed effects on KCNQ2/Q3. All error bars indicate SEM. A: Mean KCNQ5 current traces in the absence (Control) and presence of 1% green tea extract (GTE) (n = 5). B: Left, mean tail current; right, mean normalized tail current (G/Gmax) verses prepulse voltage for traces as in A (n = 5). C: Scatter plot of unclamped membrane potential (EM) for cells as in A (n = 5). Statistical analyses by two-way ANOVA. D: Mean KCNQ2/KCNQ3 traces in the absence and presence of 1% GTE (n = 4). E: Mean prepulse currents verses prepulse voltages for traces as in D (n = 4). F: Left, mean tail current; right, mean normalized tail current (G/Gmax) verses prepulse voltage for traces as in D (n = 4). G: Scatter plot of unclamped membrane potential (EM) for cells as in D (n = 4). Statistical analyses by two-way ANOVA. H: Scatter plot of activation rate τ values in the absence and presence of 1% GTE for 0, 20, and 40 mV for traces as in D (n = 4).